Lighter on the wallet, on your body, and on the planet. Broccoly turns grocery receipts into a clear picture of how you actually eat.

Most people are surprised by their grocery bill every month. Broccoly cross-references each receipt with Open Food Facts to add categories, processing levels, scores, and origin, so a pile of receipts becomes a record of your real eating habits over time.

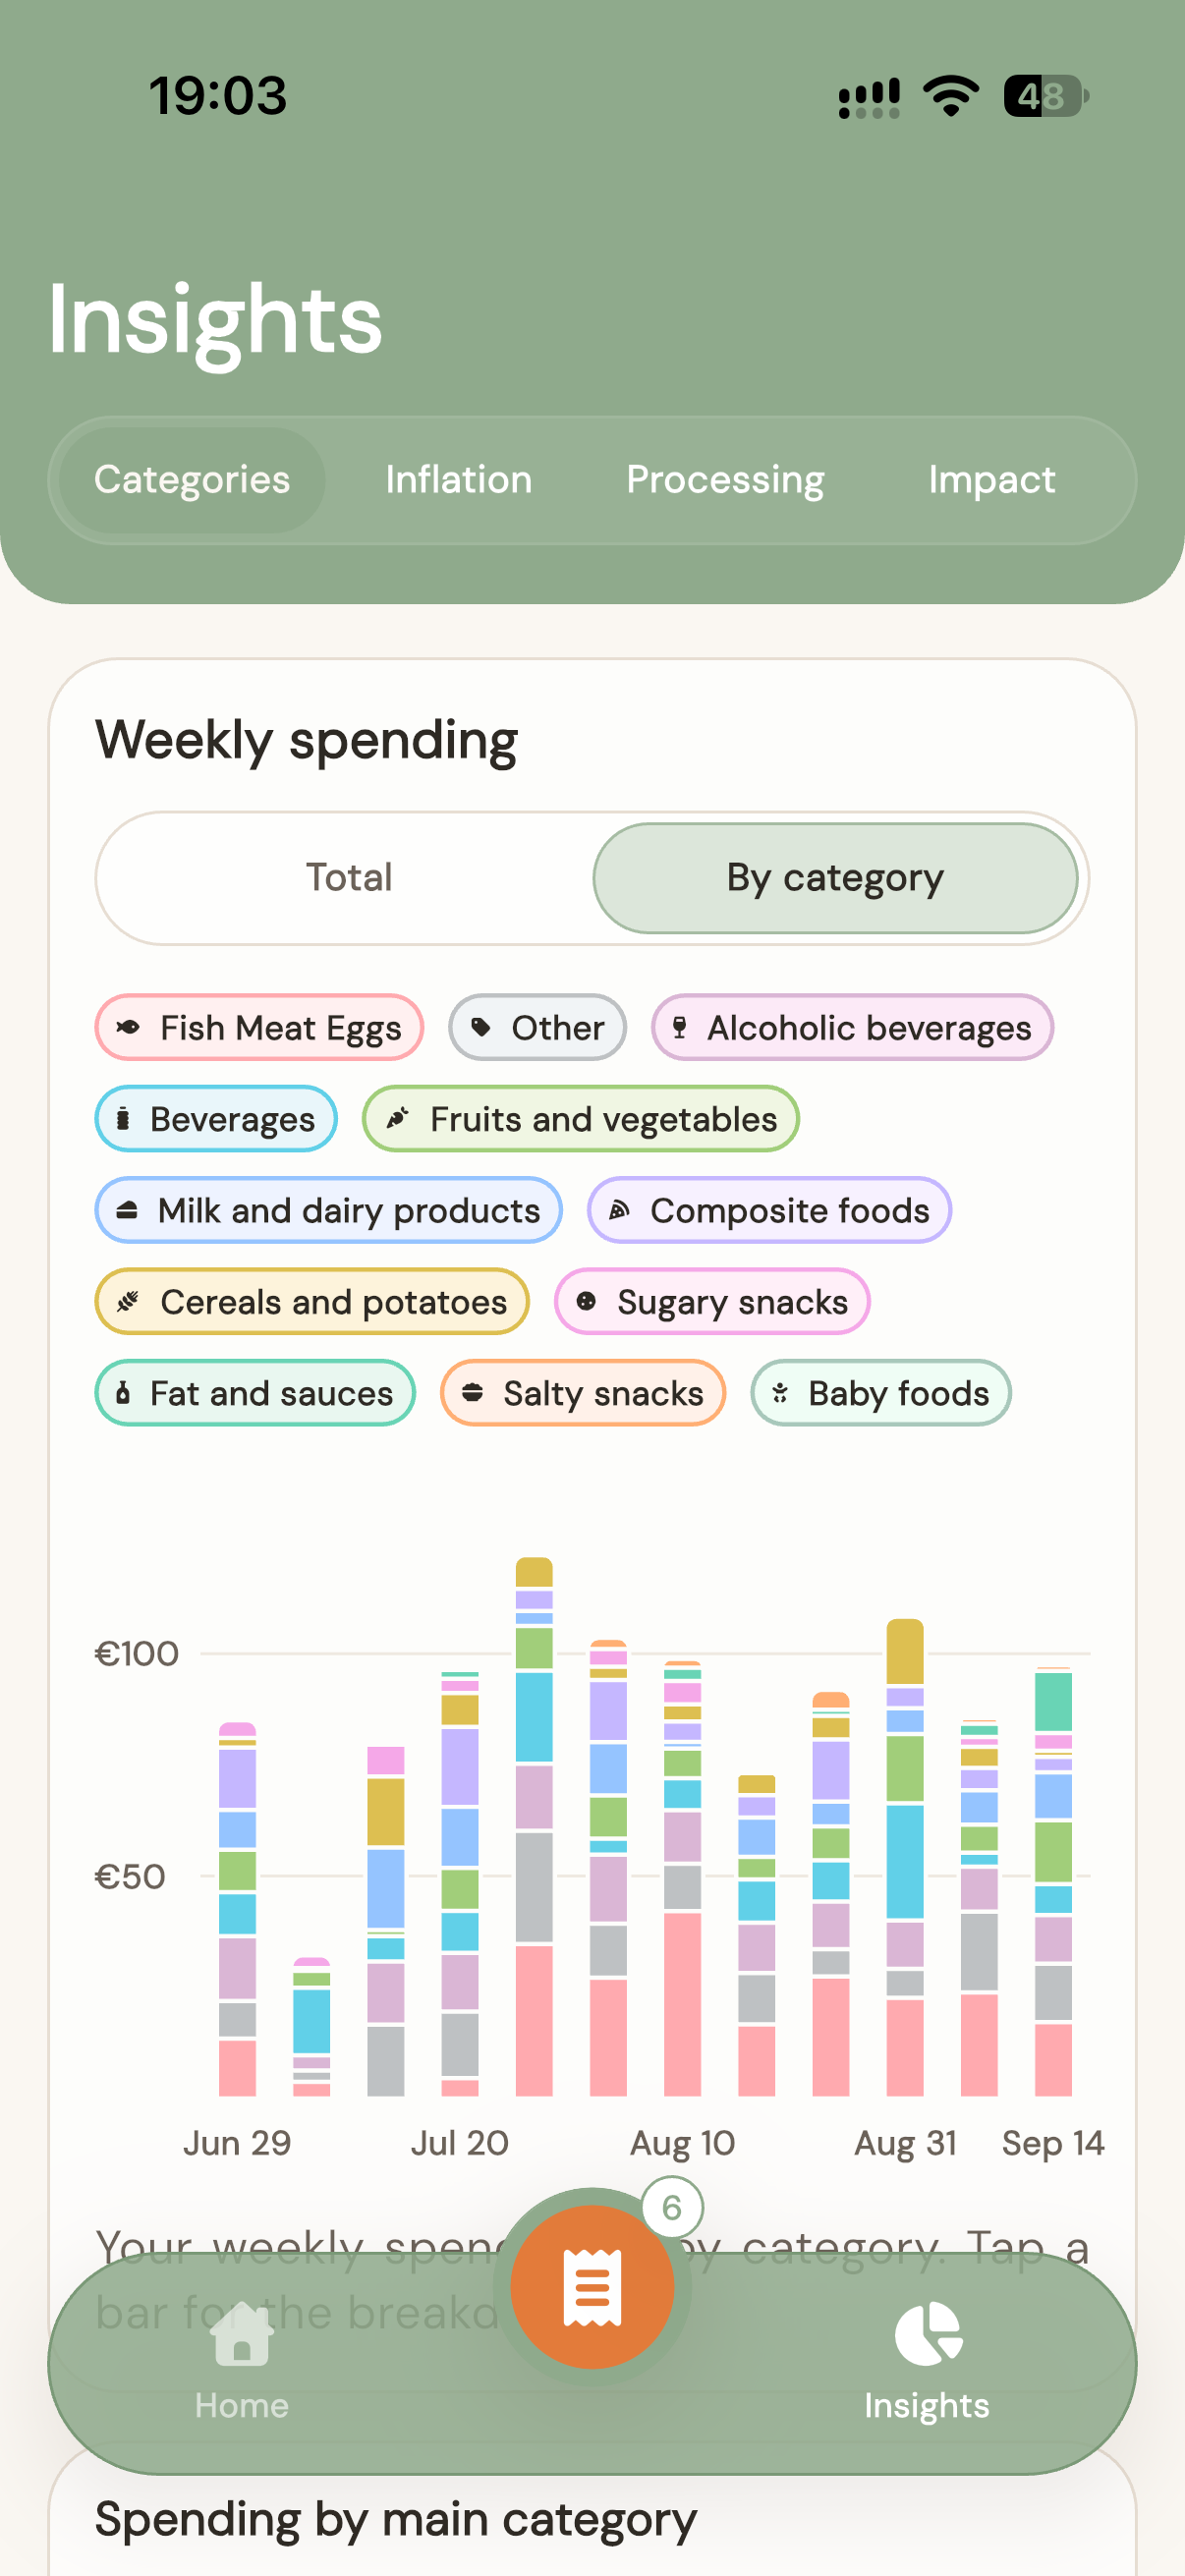
Weekly spend stacked by category, with a tap-through breakdown per bar.

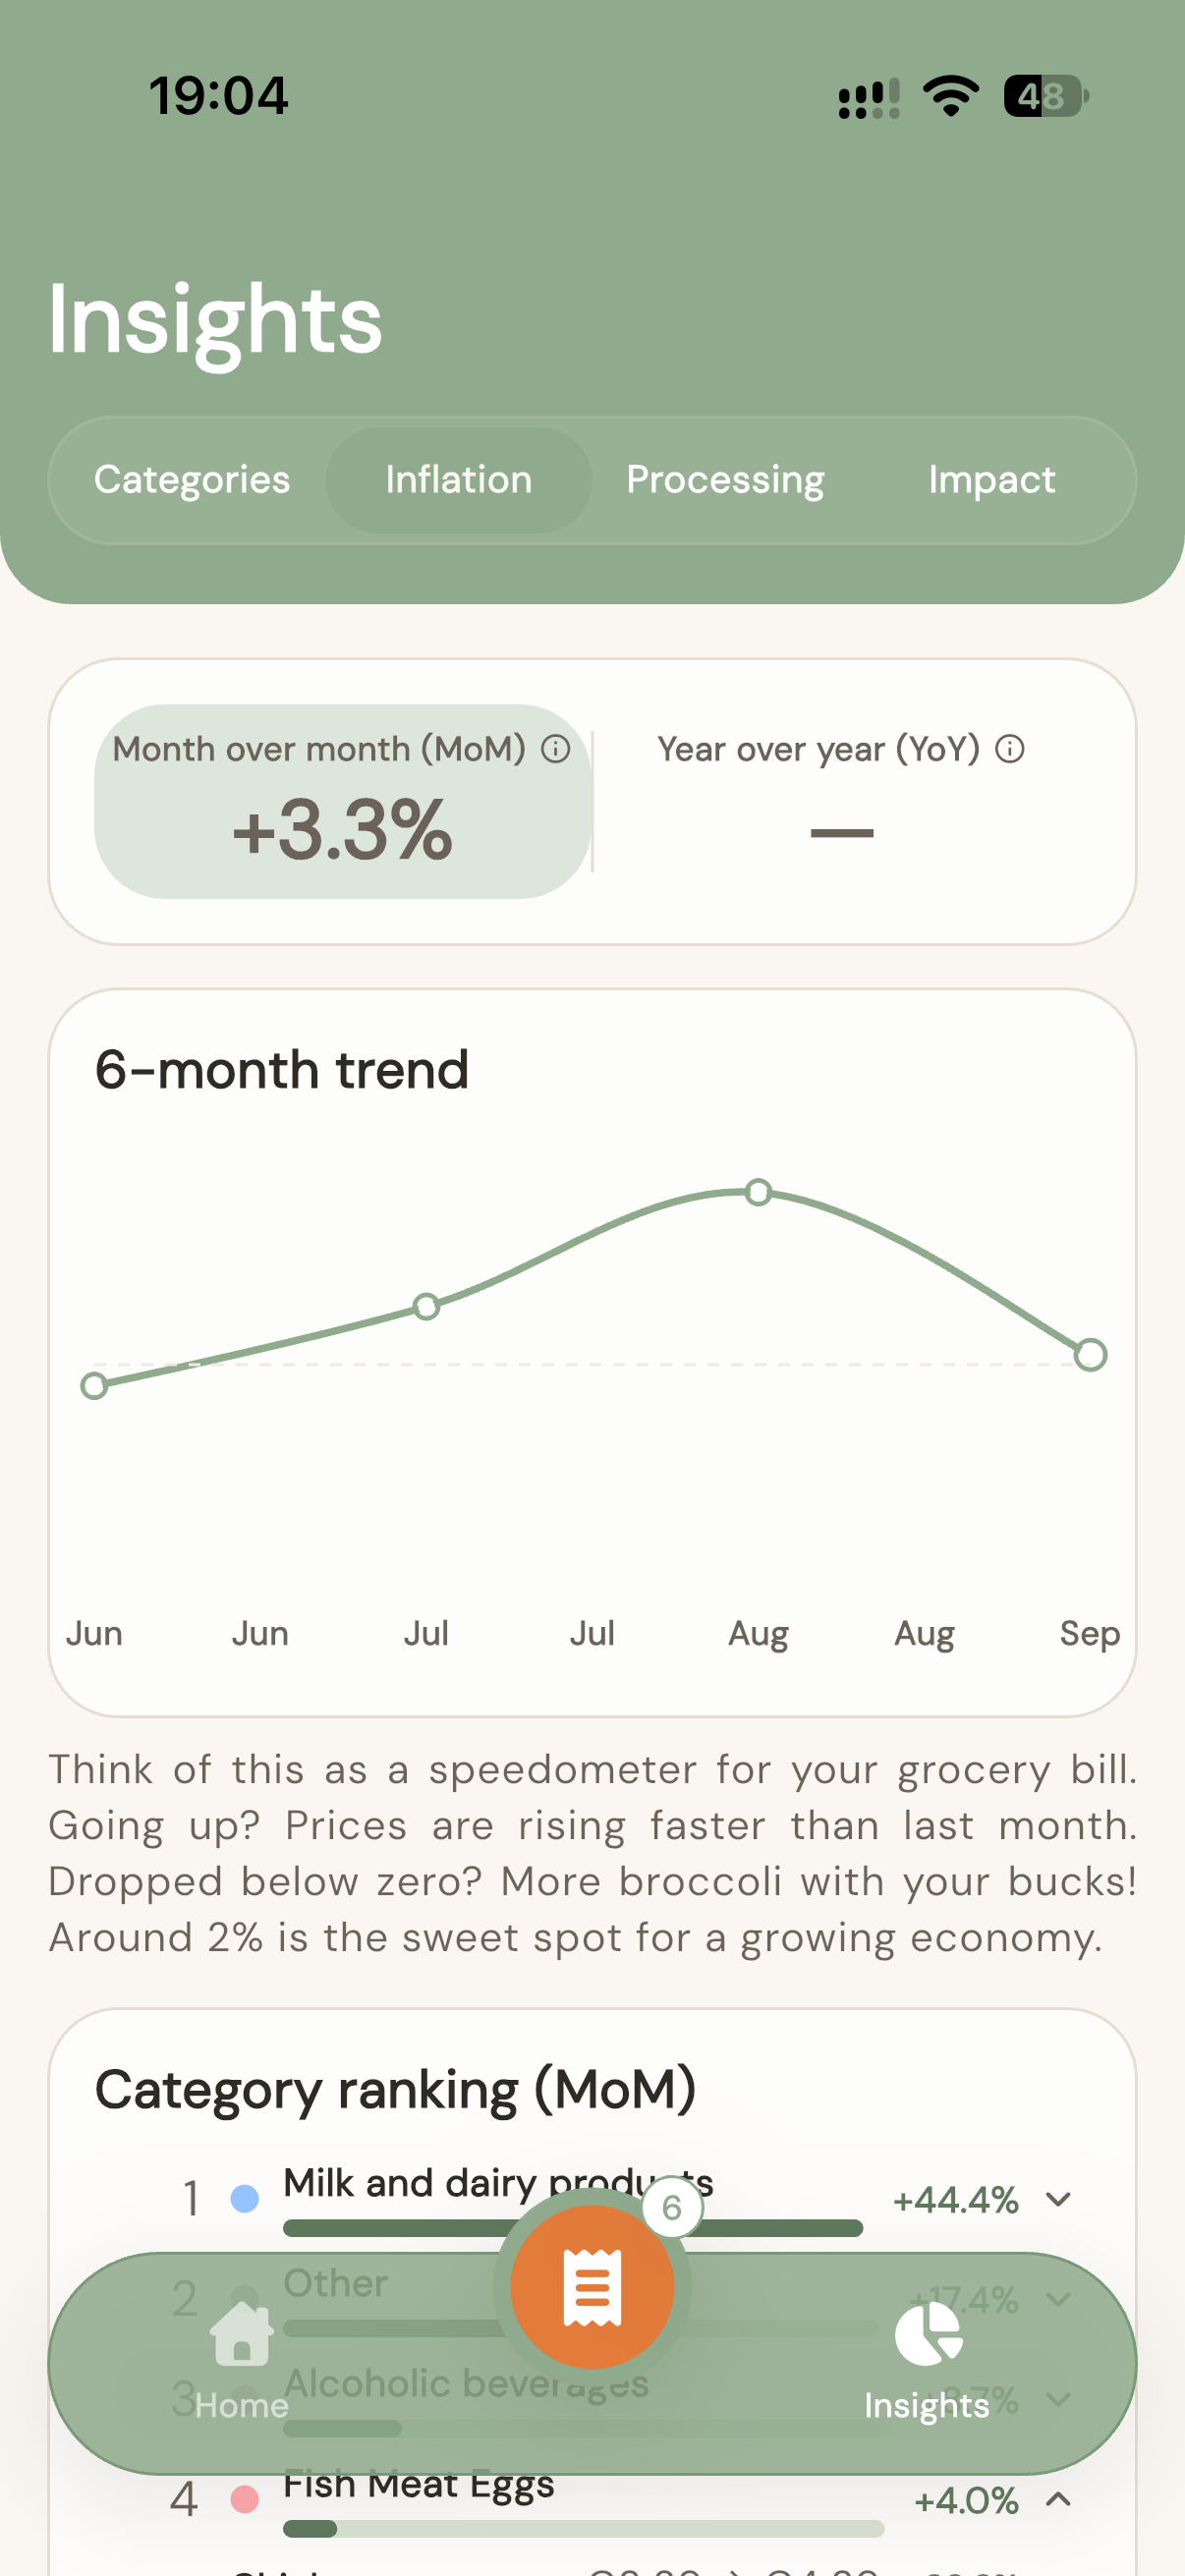
Your basket's own price changes — month- and year-over-year, with a six-month trend line.

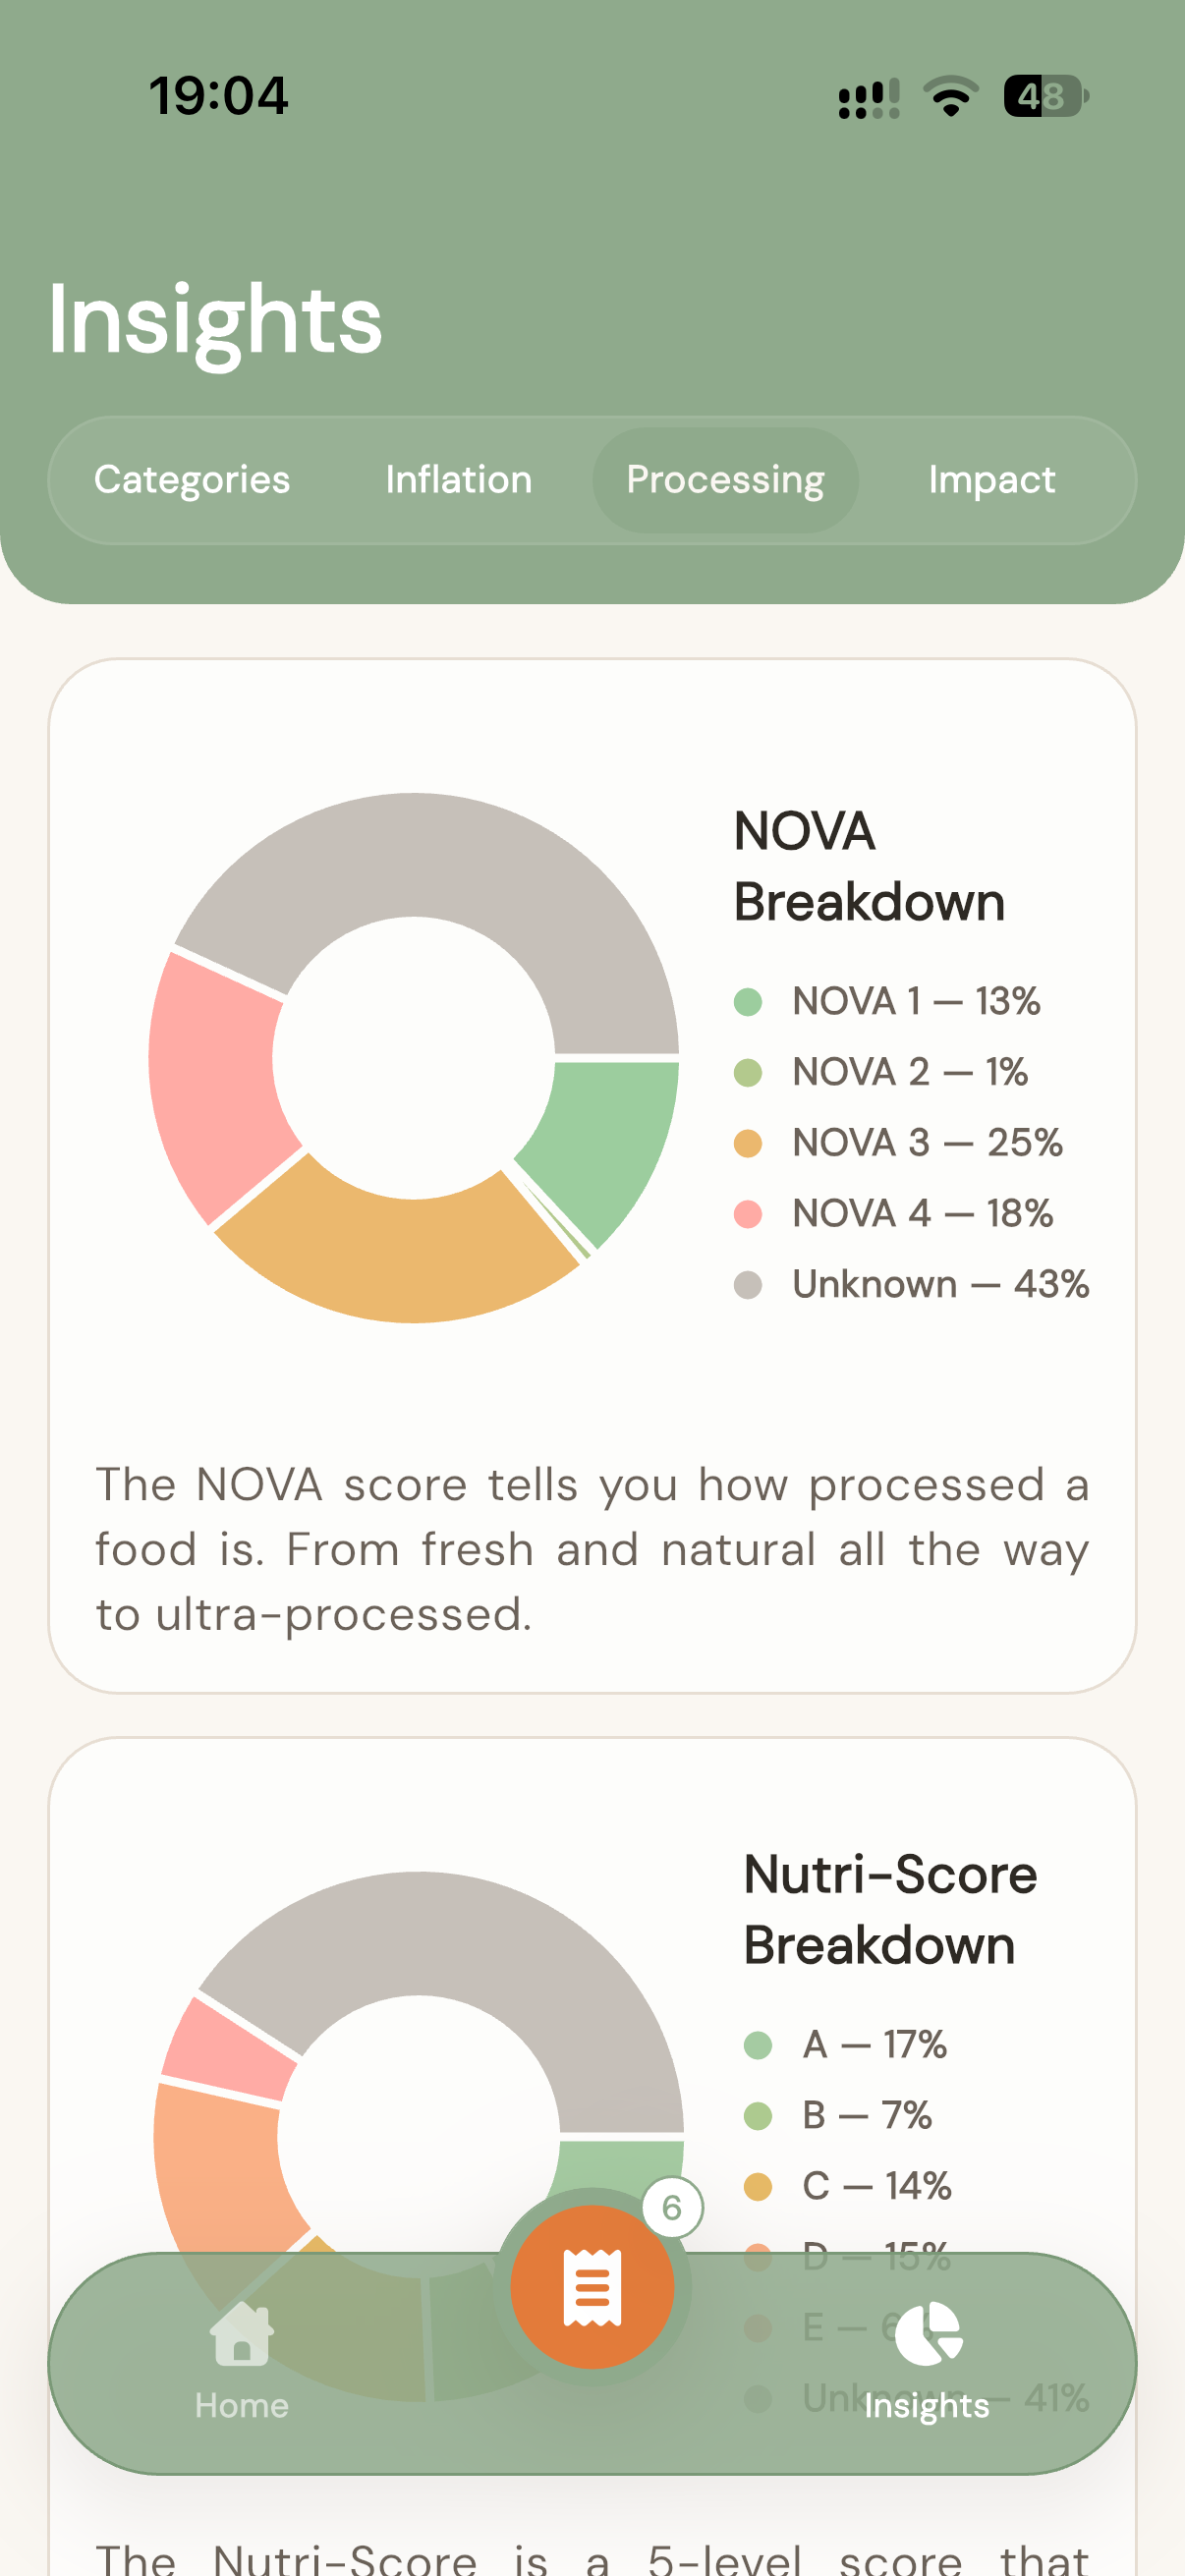
NOVA processing levels and a Nutri-Score breakdown across everything you bought.

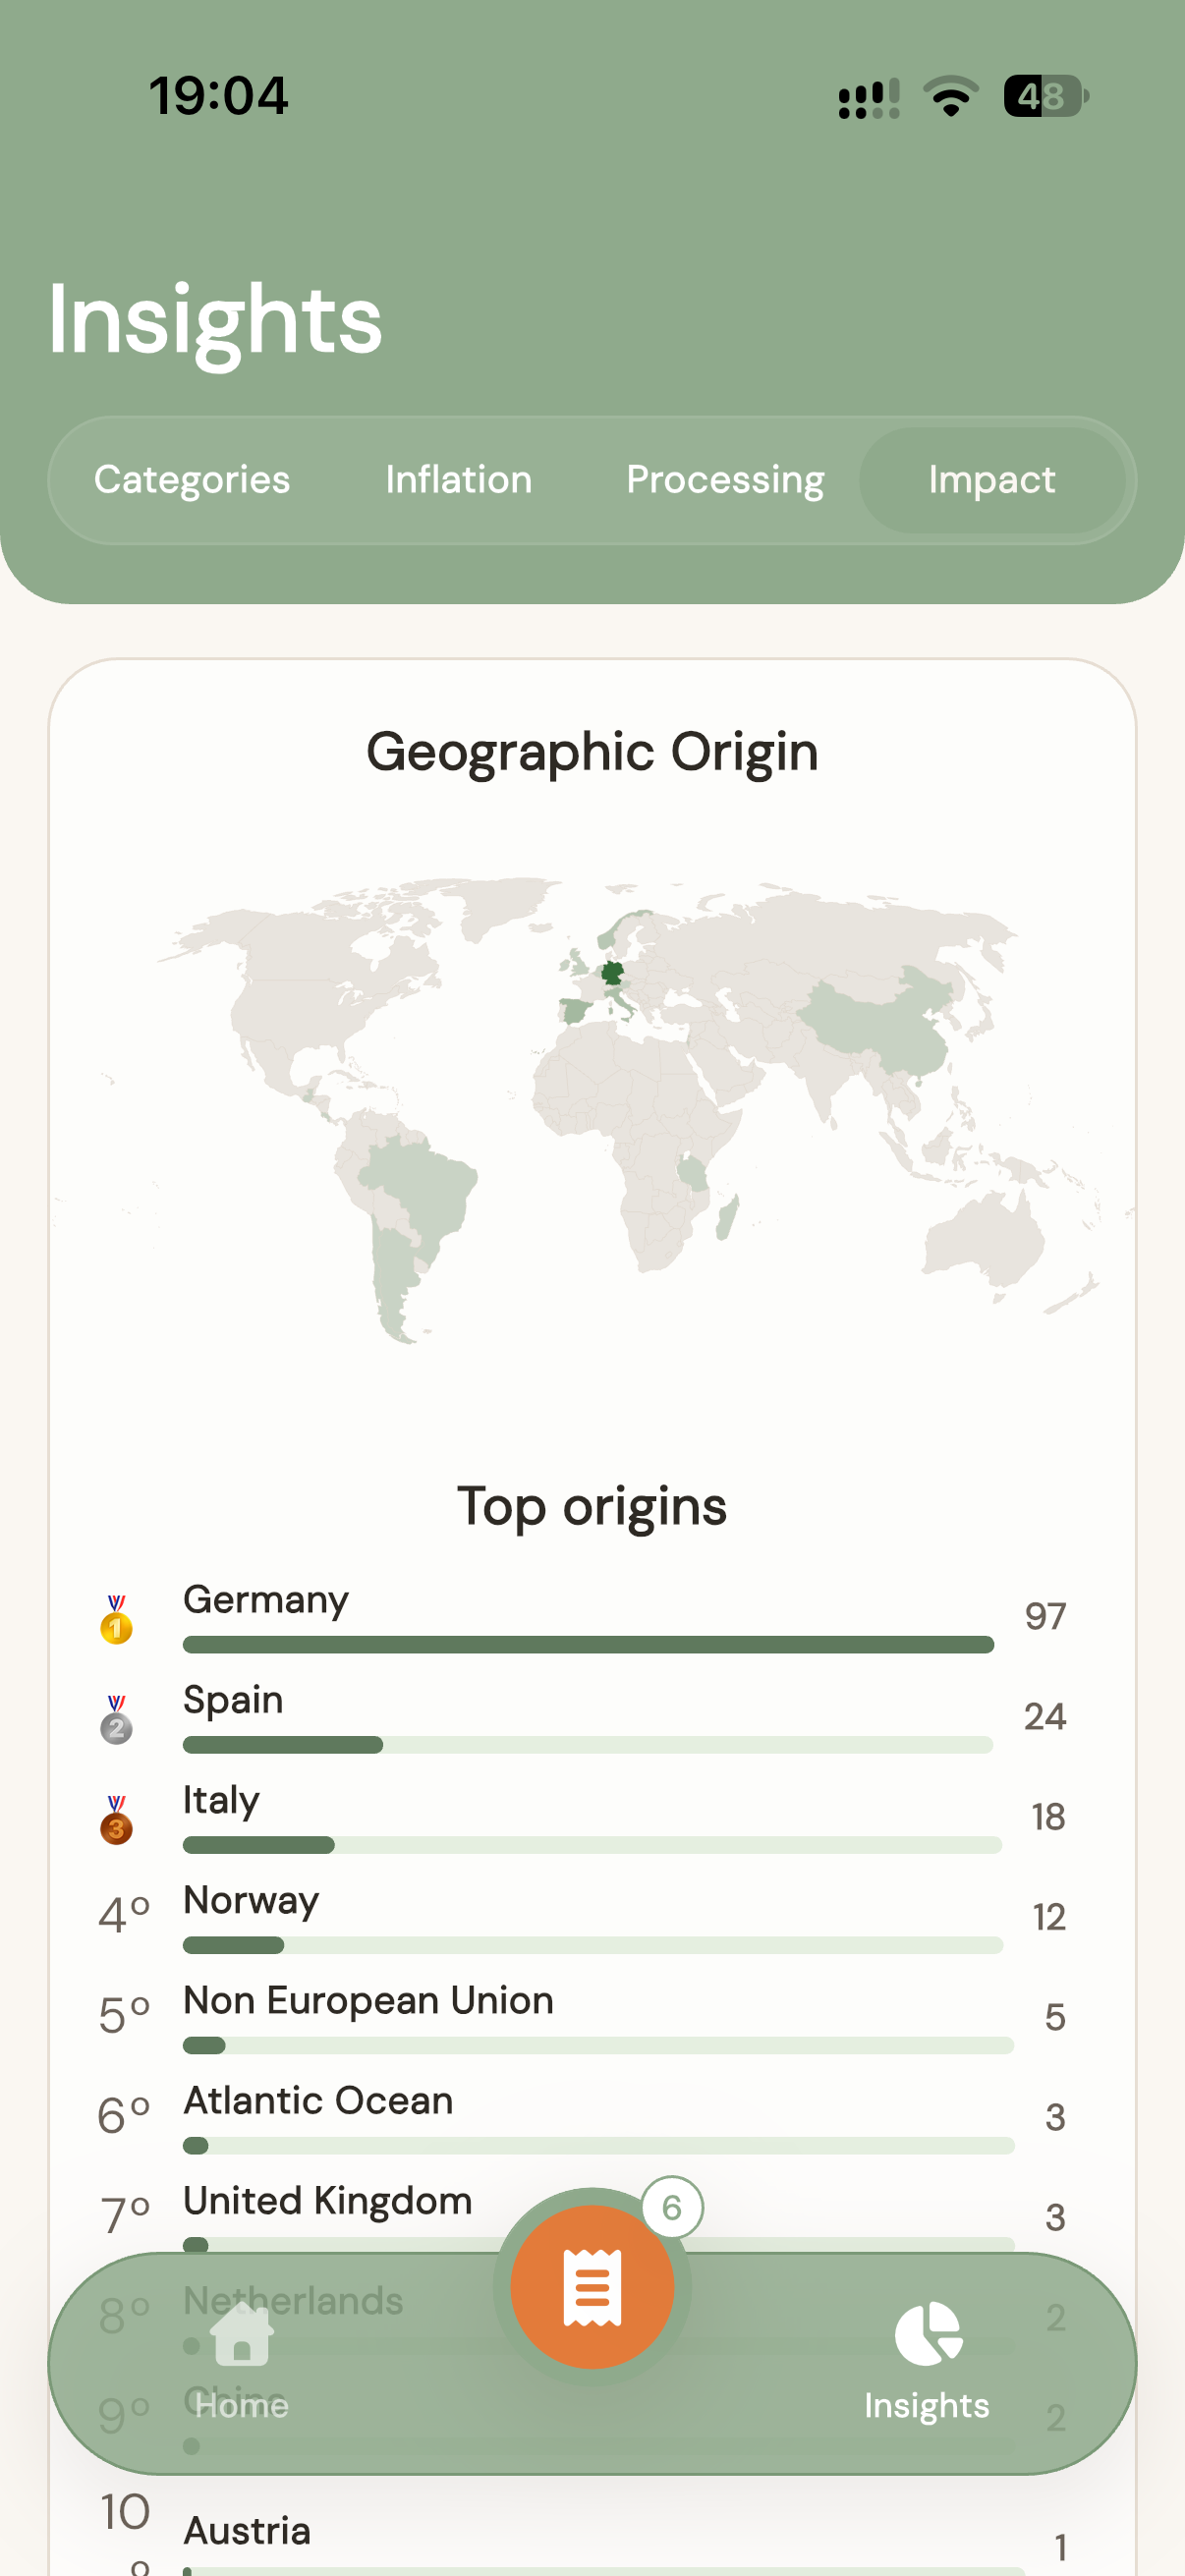
Where your food travels from, ranked, mapped, and tied to its Eco-Score.
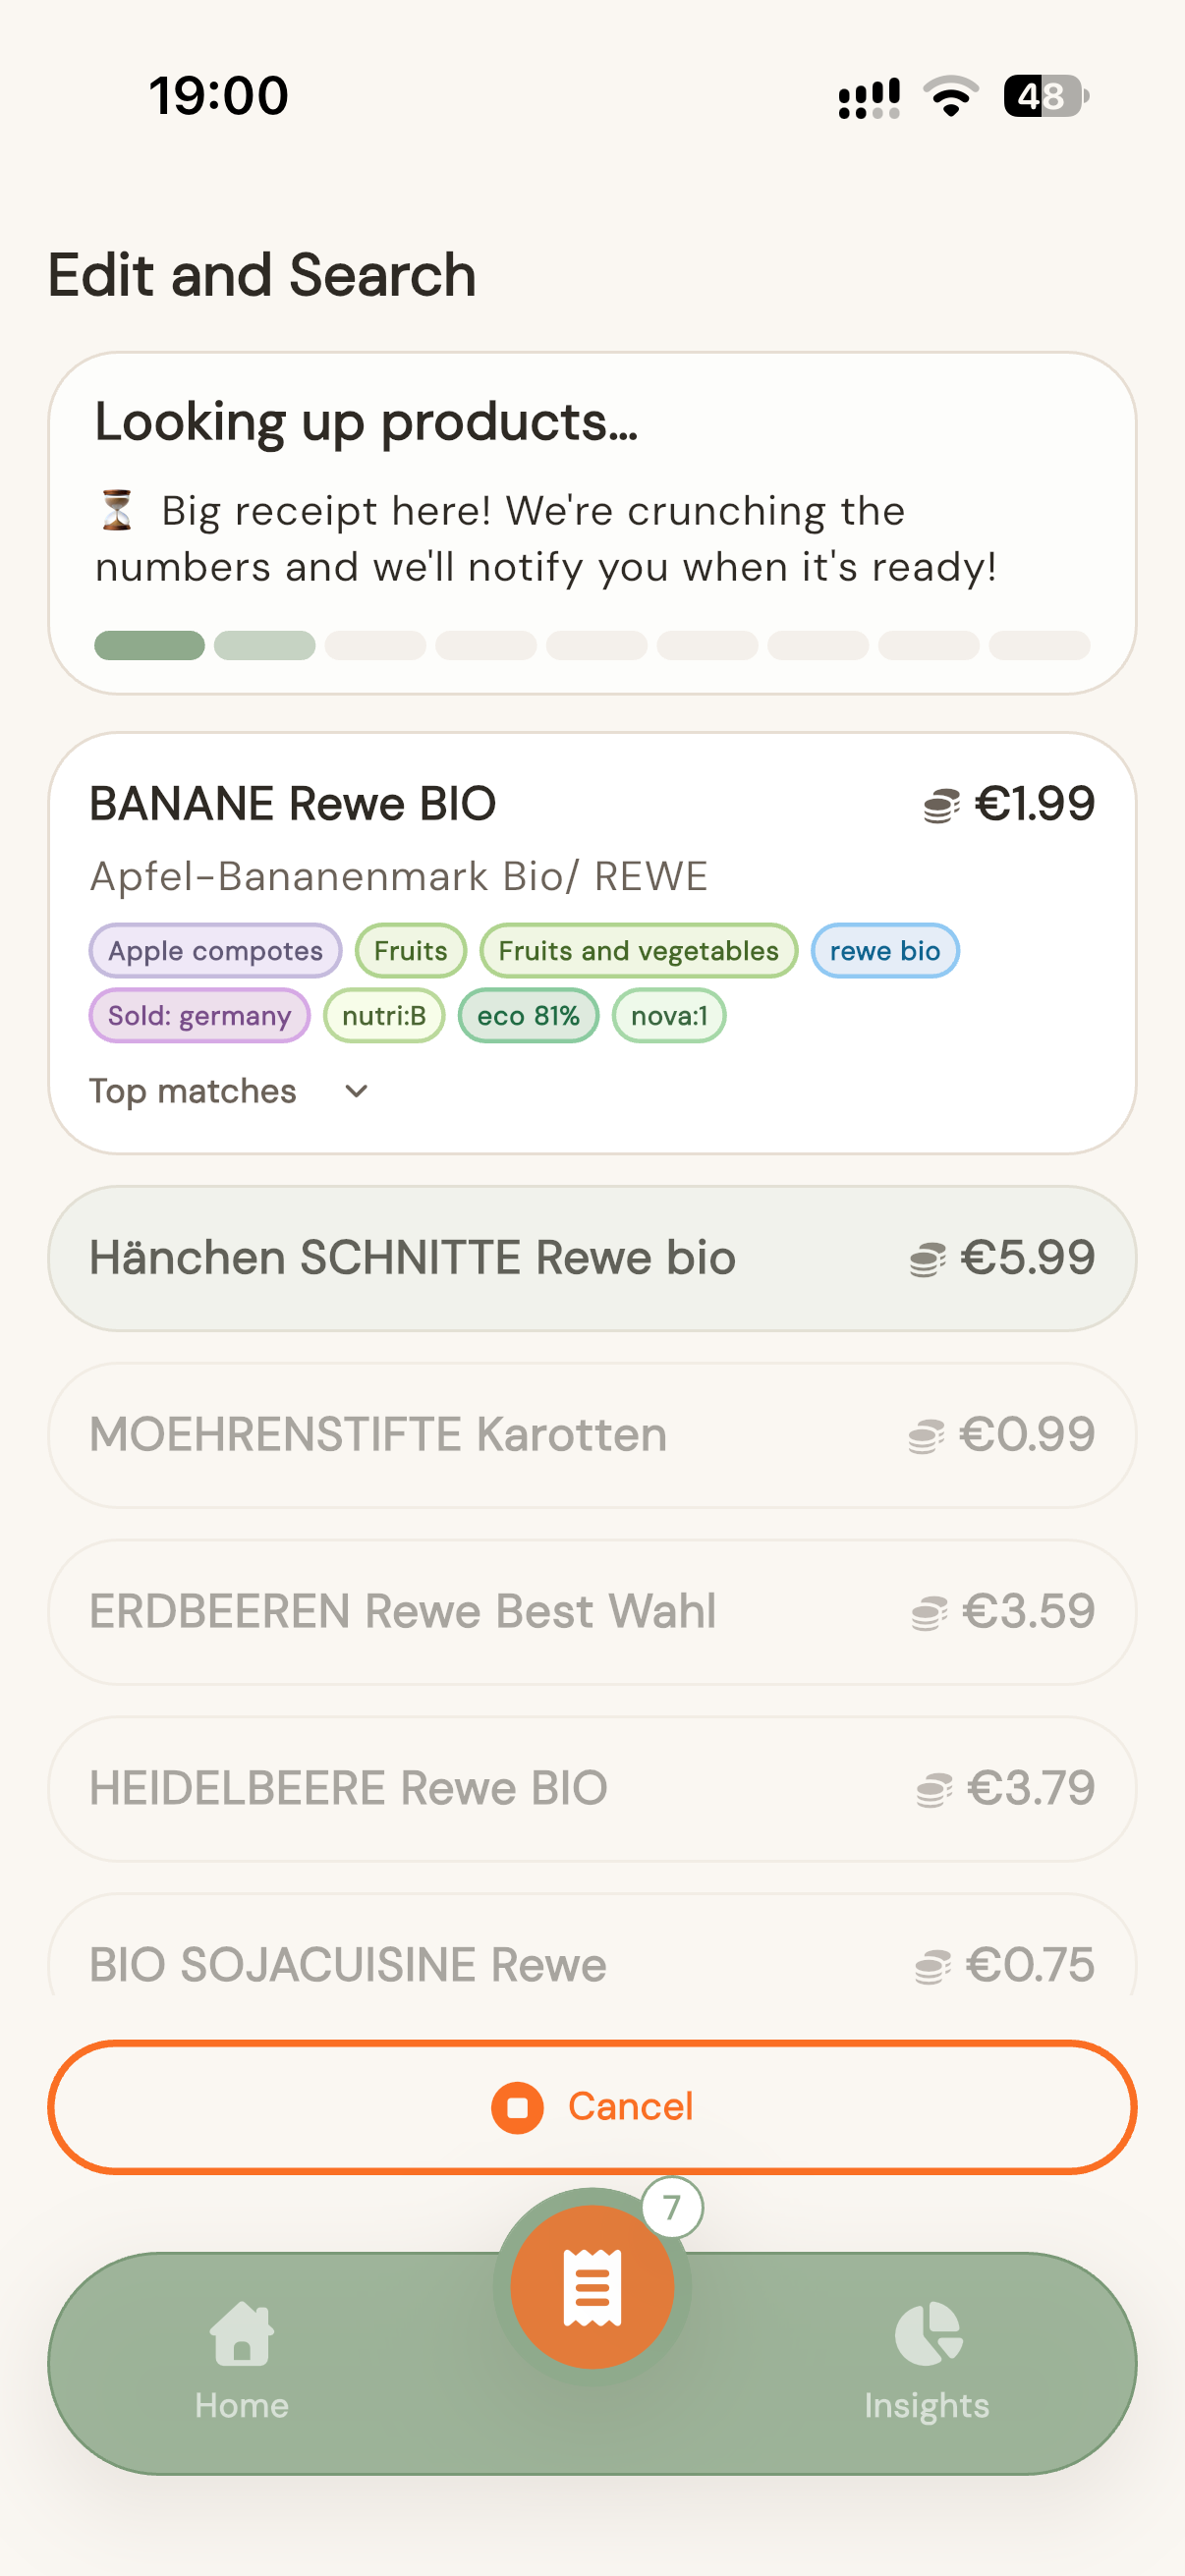
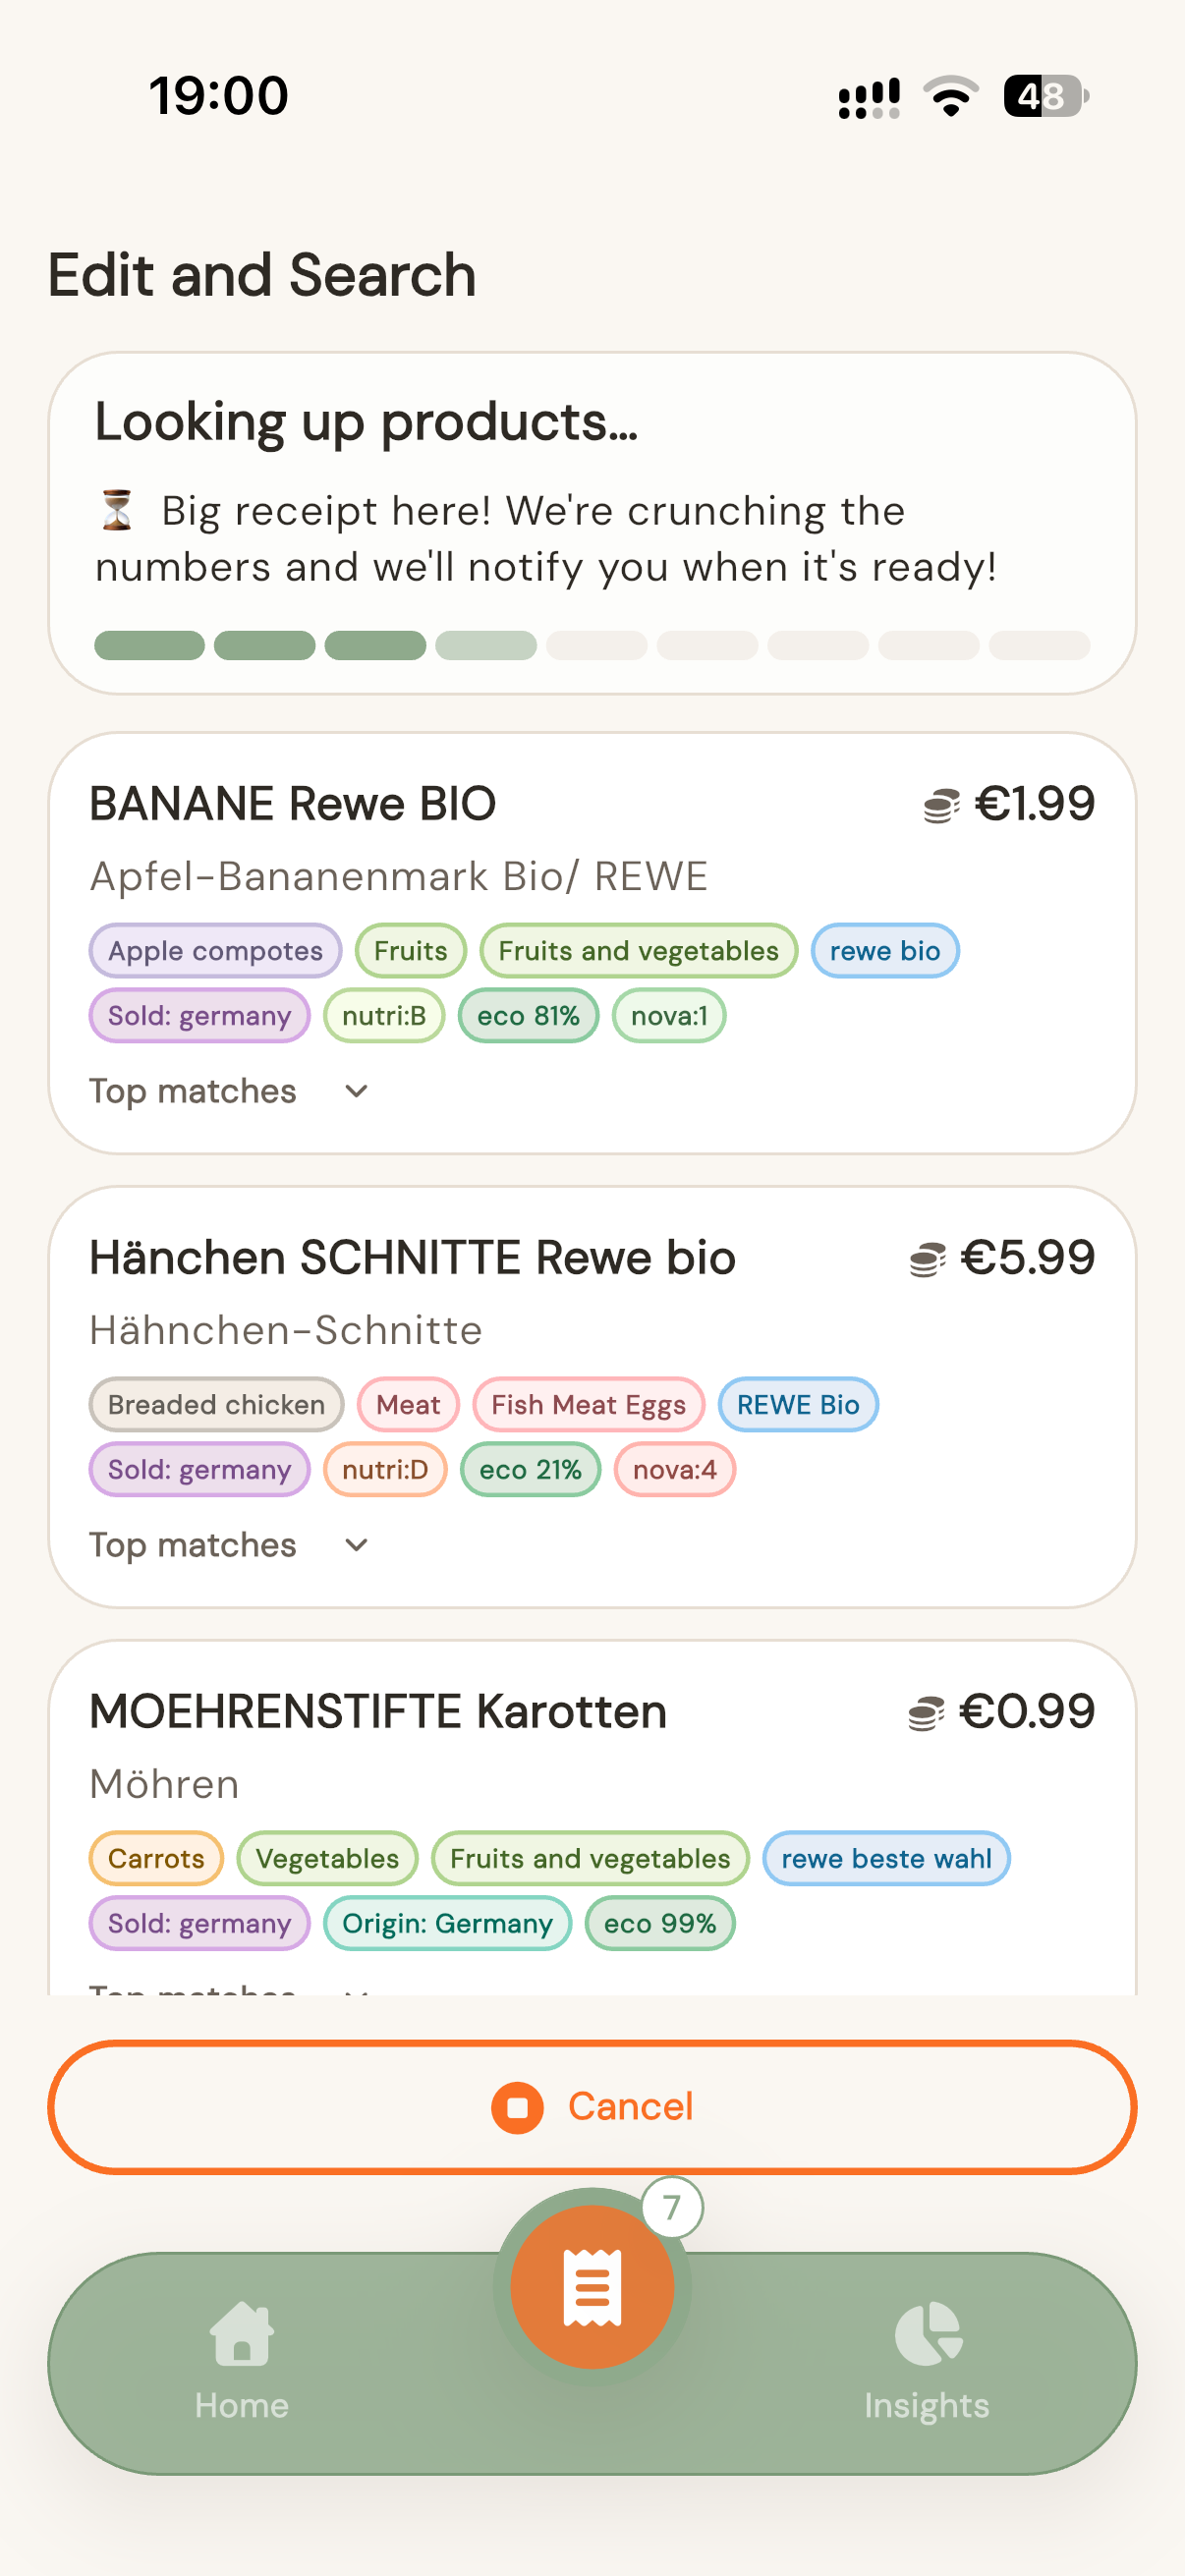
Scan, match, and watch every line item gain a category, scores, and an origin.

Each line is matched against millions of products, with the best candidates ranked by score for you to confirm.

The finished receipt: every item tagged with category, Nutri-Score, NOVA level, and where it was sold or grown.
Scan once. Broccoly handles the parsing, matching, and enrichment, then turns it into charts you can read at a glance.
Photograph a receipt and Broccoly pulls out the line items for you, right on your phone.
Your receipt becomes clean items with name, price, and quantity, without the photo ever leaving your phone.
Matched items are looked up in Open Food Facts for category, NOVA group, Nutri-Score, Eco-Score, and origin.
Track how much you spend per food category over time with interactive charts.
Month-over-month and year-over-year price changes for your own basket, with a six-month trend line and per-category breakdown.
See the estimated environmental cost of your basket, broken down by category.
Understand the NOVA breakdown of your purchases, from minimally processed to ultra-processed, and how it shifts month to month.
A world map of where your food comes from, weighted by how much of it you buy.
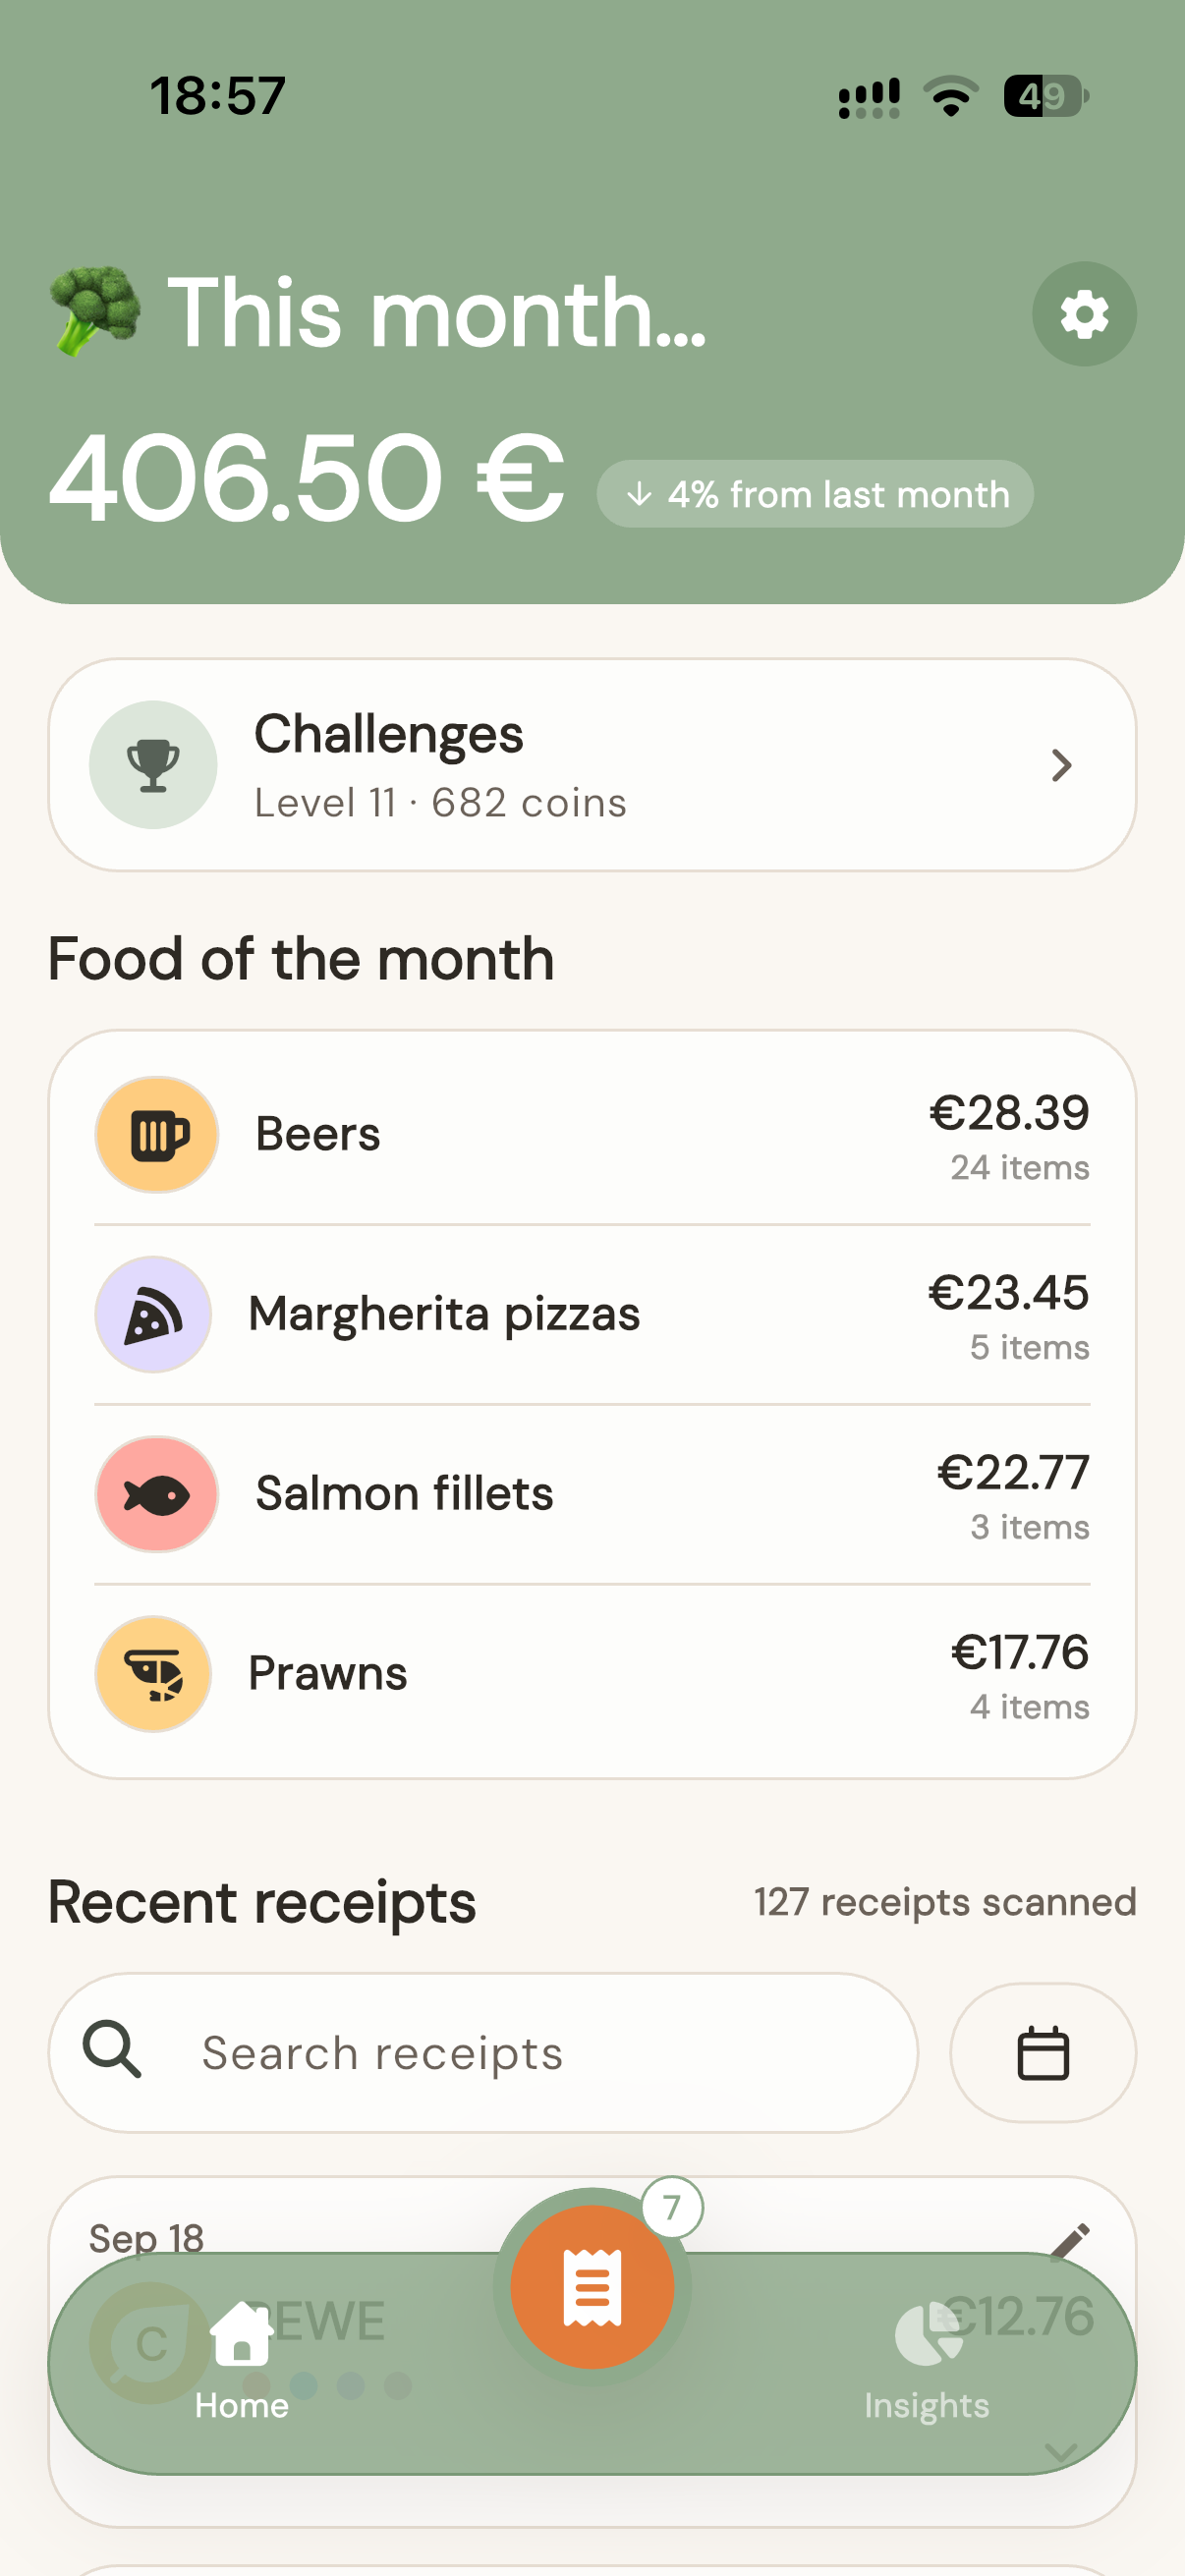
A searchable log of every scanned receipt, plus live enrichment progress on the Lock Screen and Dynamic Island.
Photograph a receipt. It's read on your phone, with nothing uploaded.
The text becomes clean line items with names and prices, on your device.
Each item is matched to a product in the Open Food Facts database.
Each match brings its category, Nutri-Score, NOVA level, Eco-Score, and origin.
Everything feeds the Insights tabs: spend, inflation, processing, impact, and the origin map.
Planned for a future release.
The same product, tracked across every shop you scan, so you can see what is actually cheaper where — and whether last week's bargain still is one.
For the nerds: every receipt, line item, price, and score as a plain CSV. It is your data — take it to a spreadsheet, a notebook, or wherever you like.
Broccoly is out now on the App Store. Free, no account, no ads.
Download on theApp Store